Founder · 1939–2026

Peter Eliades

A lawyer turned piano man who became one of the country's best-known cycle analysts. His last project put fifty years of cycles work into traders' hands.

Peter Eliades
01 · 1939–1967

Before the markets

Peter was born in Lowell, Massachusetts, in 1939, the son of a Greek immigrant who later became the city's mayor. He played football at Lowell High and at Harvard, graduating in 1960, then earned his law degree from Boston University in 1963.

He was expected to join the family law practice. Instead, he went to New York, where he sang and played piano in the city's piano bars and appeared in an off-Broadway show. In 1967 he headed for Los Angeles, intending to become a star.

Looking back on those years in a 1989 Forbes profile, Peter said: “I like to think I had the talent, but I was lazy.”

02 · Los Angeles

A book on a coffee table

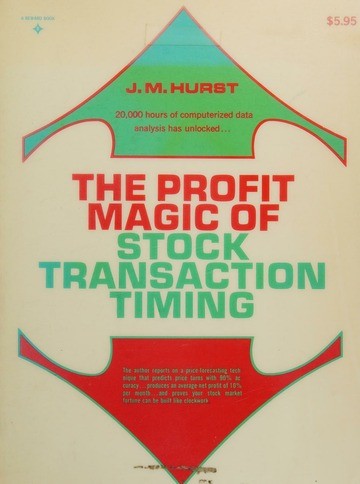
Cover of The Profit Magic of Stock Transaction Timing by J.M. Hurst
J.M. Hurst's The Profit Magic of Stock Transaction Timing, the cycle theory Peter built on.

In Los Angeles, after he bought a mutual fund that had soared then plummeted, Peter was looking to understand why and picked up a book about stock market cycles from a friend's coffee table. He would later describe it as one of those single moments that changes everything that follows. The book, J.M. Hurst's The Profit Magic of Stock Transaction Timing, argued that the market is driven by interacting cycles of different lengths.

From the early 1970s on, Peter built his own approach on Hurst's work and spent the rest of his career refining it.

03 · 1974–1975

The call

Several times in the fall of 1974, after nearly six years of falling stock prices, Peter said on KWHY, the nation's first full-time financial television station, that a major market bottom would come during the week of December 9–13. The Dow's low came on December 9.

The forecast drew national attention, and in July 1975 he published the first issue of his newsletter, Stockmarket Cycles.

Forecast window
Dec 9–13, 1974
Dow low
570.01 · Dec 9
First newsletter
July 1975
04 · 1975–2011

Five decades of cycles

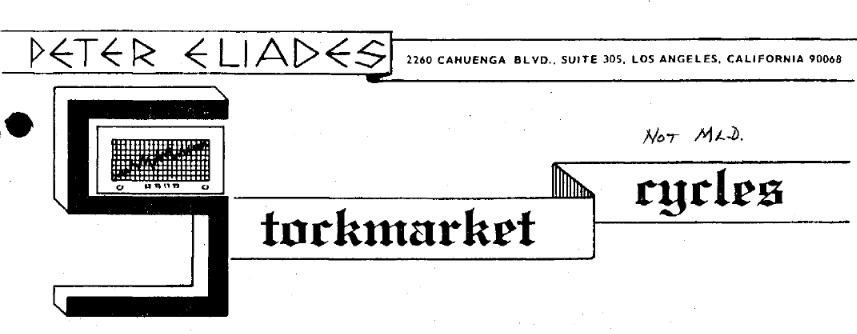
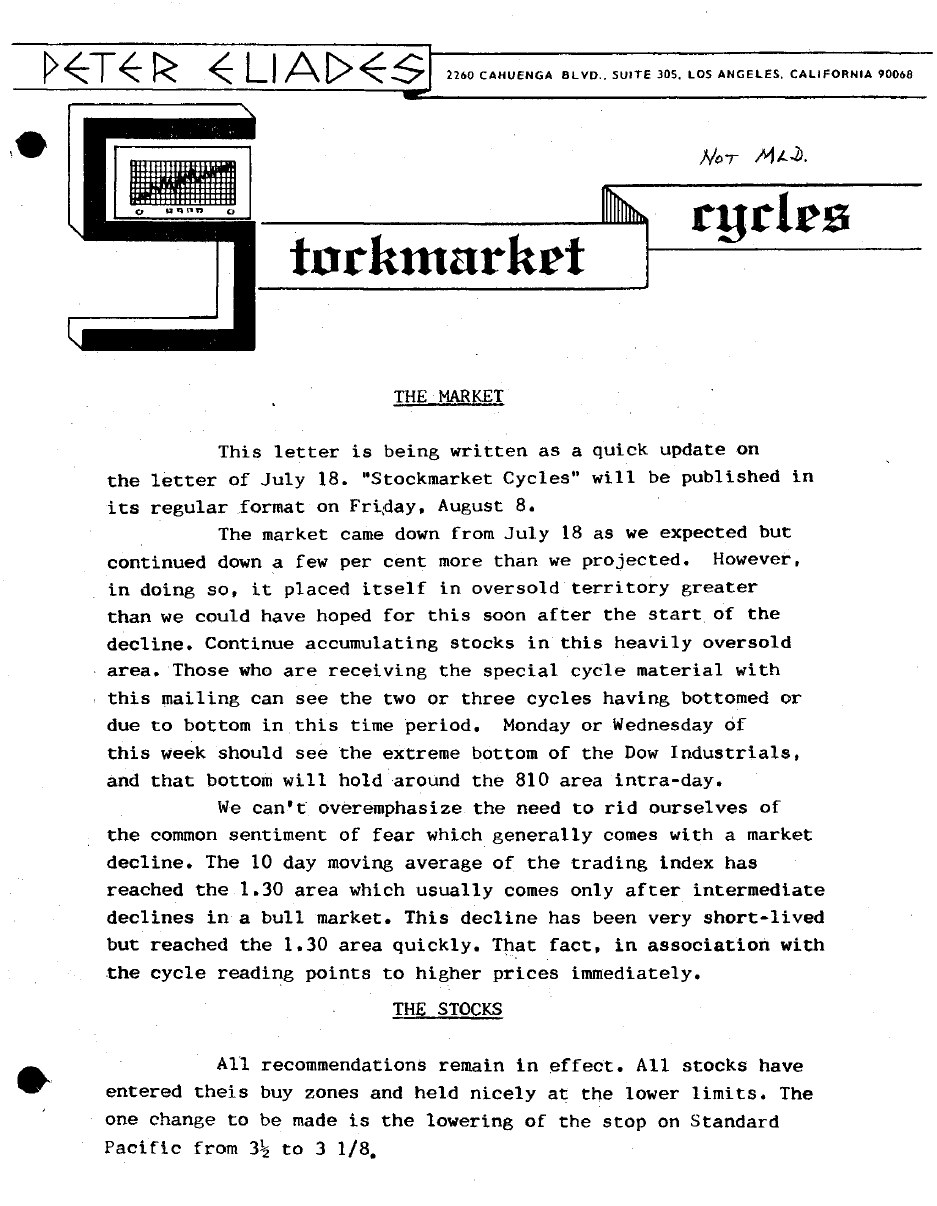
The original Stockmarket Cycles newsletter masthead, with Peter Eliades' name and a Los Angeles address
The newsletter's original masthead, from its Los Angeles years.

Over the following decades Peter became a familiar voice on financial television and in print. He developed original technical indicators, gave the Open 10 TRIN its name, and published Stockmarket Cycles until 2011, but never stopped writing market updates whenever the market gave him something to say.

Recognition
Timer Digest's Timer of the Year (1985). The Market Technicians Association's Charles H. Dow Award (2001).
Television
FNN, CNBC, Wall Street Week, ABC's Business World, and for many years Fox Business with Neil Cavuto.
In print
Barron's, The Wall Street Journal, Forbes, a Futures magazine cover story, and books on technical analysis.
Cover of New Thinking in Technical Analysis: Trading Models from the Masters, edited by Rick Bensignor
The foundation

Using Cycles for Price Projections

Peter set out his price projection method in Chapter 7 of New Thinking in Technical Analysis: Trading Models from the Masters, edited by Rick Bensignor. That chapter is the basis of the Eliades Cycle Price Projections app: the offsets, the crossings and the projected price windows all start here.

“At any one time there are theoretically scores of cycles acting simultaneously on the market.”

Peter Eliades, on his market philosophy
05 · 2018–2026

The culmination

Peter's cycle projections had been turned into software before, but never with the precision he wanted. In 2018 his longtime friend and colleague Larry Williams introduced him to trader and programmer Steffen Scheuermann. Within weeks, the refinements Peter had sought for decades began to take shape.

In 2020 they released Eliades Cycle Price Projections, the most complete expression of his method, and kept refining it together for years, bringing it to TradeStation, TradingView and the web.

Peter kept watching the markets and writing to his subscribers until only weeks before he passed in 2026.

Interviews & press

The archive.

Television interviews, podcasts and articles from 1982 to 2025, newest first.

  • Fox Business · Making Money with Charles Payne
    The public's growing interest in the stock market
  • MarketViews.tv
    The NDX/Dow ratio at one of its highest readings in 40 years
  • Fox Business · Cavuto
    The market hasn't been this overextended since the dot-com bubble
  • Foundation for the Study of Cycles · Cycles TV
    Cycles TV special on current stock market cycles
  • MarketViews.tv
    The current market situation
  • The Sunny Harris Show
    Great cycle analyst and daily cycle update guru
  • Fox Business · Cavuto
    Predictions for the market
  • Foundation for the Study of Cycles · Cycles TV
    Current global market developments
  • MarketViews.tv
    Why the 9/2/21 high could stand for a long time
  • MarketViews.tv
    Why the market may be entering the "Danger Zone"
  • MarketViews.tv
    The current markets, with Ike
  • Tim W. Wood's Cycles News & Views
    Cycles News & Views interview
  • The Lance Roberts Show
    The most important indicator of all
  • Fox Business · Cavuto
    An overvalued stock market
  • Tim W. Wood's Cycles News & Views
    Cycles News & Views interview
  • Fox Business · Cavuto
    Could volatility turn into a deeper bear market?
  • Fox Business · Cavuto
    What market history suggests about the months ahead
  • Tim W. Wood's Cycles News & Views
    Cycles News & Views interview
  • Goldseek.com Radio
    Conversation with Chris Waltzek
  • CFRN
    Fibonacci expansions (the interview starts at 56:40)
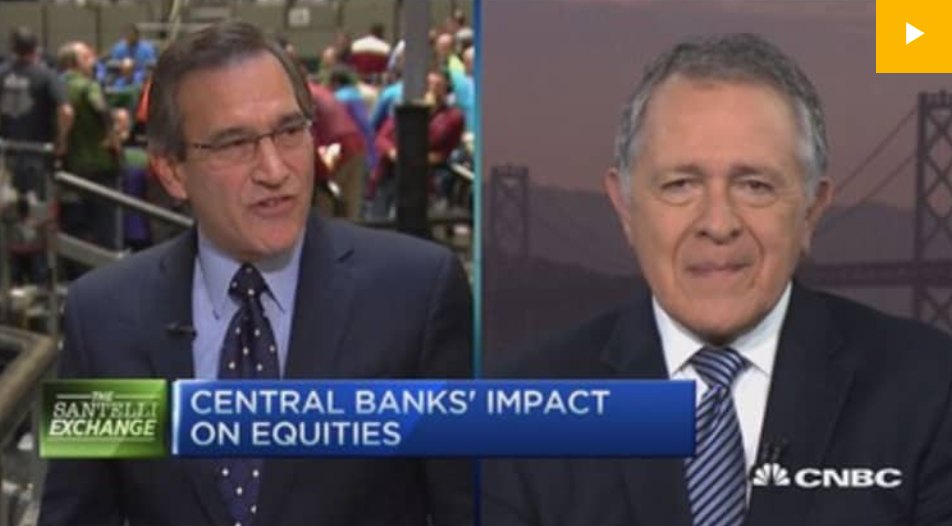
  • CNBC · Rick Santelli
    The long-term S&P 500 trendline
  • Goldseek.com Radio
    Conversation with Chris Waltzek
  • CNBC
    Eliades: A potential market bottom of some kind
  • Stockmarket Cycles Update ahead of the October 2007 decline Read article

    We asked ourselves after today's strong advance in the stock market whether we felt we had been putting too much emphasis on the potential for a very sharp October decline this year. After doing some soul-searching and writing the newsletter which is going out this weekend, it is easy to answer that question. The answer is, "Not yet!" We say that because today's rally has not in any way be important pattern that we have been delineating that begins, on average, on October 3rd of every year ending in the digit 7 and ends in the following month on November 8th. As we have so often stated recently, the average decline over that time span has been over 14% on a closing basis for the Dow Jones Industrial Average.

    In today's newsletter, we itemize the date of the high closing price for October in each of the 11 previous years ending in the digit 7. Let's repeat them for you here:

    1897 October 4th

    1907 October 1st

    1917 October 1st

    1927 October 3rd

    1937 October 2nd

    1947 October 20th (this was the only year that was up over the stated span)

    1957 October 3rd

    1967 October 9th

    1977 October 1st

    1987 October 2nd

    1997 October 7th

    Over 50% of those closing highs for the month of October within the years ending in 7 occurred in the first two trading days of the month (the 1927 high on October 3rd was the second trading day of that month). After today's rally, you might think that there is no chance for that to occur this year. But take a close look at the close of the Dow on October 1st and you might be surprised to discover that today's close was lower than the October 1st close despite the strength of today's rally. That could, of course, change as early as Monday of next week, but so far the high close has been on October 1st for the Dow.

    It might also be interesting to note that the 54 month pattern that we discussed yesterday has resolved on the first second trading day of the month since 1994. All these factors make next week's market action quite important.

    It is also important because strength into the end of next week will almost surely confirm significantly higher projections on the weekly projection charts.

    The McClellan Oscillator closed today at + 180.3 with the McClellan Summation index at + 1,931.2. The ratio adjusted McClellan Oscillator closed at + 54.5 with its Summation index at + 277.7. The CI/NCI ratio closed at 1.035 with the S&P ratio at 1.035. This is the first time in the market's advance since the August 16th low that the CI/NCI ratio has reached the zone beginning at 1.035 and upward which tends to mark market tops.

    Mutual-fund switchers— Rydex switchers are in the Rydex S&P 500 Inverse 2X Strategy Fund. Fidelity switchers are in 100% cash positions. All mutual-fund switchers should call the telephone update each market day after 3:20 p.m. Eastern time and each market evening.

    Stock-index futures traders— you were stopped out of our e-mini short at 1,568.25 because of the large gap opening and the alternate stop 5.70 above that opening for a loss of 17.50 on the trade. On Monday, sell short the December e-mini contract on any move greater than 6.75 below the opening price with a stop 1.75 above the opening price.

    Gold still has a nominal 40 week upside projection from the weekly projection charts to 802.70 ± 15.50. Bonds generated a nominal 10 week downside projection to107 31/32 ± one full point but also reestablished a nominal 40 week upside projection to 117 1/2 ± 1 1/2 points. Have a great weekend. We will talk to you on Monday.

  • Timer Digest
    Peter Eliades article and cover
  • Barron's "The Sign of the Bear" Read article

    Barron's Major Market Top Update

    In the May 4, 1998 edition of Barron's, Peter Eliades wrote an article describing his "Sign of the Bear" indicator which gave a signal in early April 1998. Within a few weeks of the signal, The Value Line Composite Geometric Index, arguably one of the most accurate indicators of the performance of an average investor's portfolio, reached a new all-time high. To this date (March 2004), that high has not been surpassed on the Value Line Composite Geometric Index. Since the "Sign of the Bear" signal in 1998, another signal was given in September 2000 within days of the all-time high in the NY Composite Index. That high also remains the all-time high to this date. The market action after September 2000 in the Nasdaq Composite and the S&P 500 makes it clear that the September 2000 signal was another fabulous success for the "Sign of the Bear."

    The Sign of the Bear, April 1998 (edited)

    April 28, 1998

    Addendum to SPECIAL report, "The Sign of the Bear"

    Since writing "The Sign of the Bear" in mid-April, we have made some new discoveries relating to the churning pattern discussed therein. Barron’s magazine has shown an interest in our research and we have been led to believe they will run a story based on the pattern in the very near future, perhaps as early as the issue dated May 4. We are sending you the updated story and research. It takes nothing away from the original research, but it narrows the parameters for the "The Sign of the Bear." The ones that remain are truly five of the most important tops of this century. We hope you enjoy our updated version.

    Peter Eliades
    Stockmarket Cycles

    Barron’s Sign of the Bear article

    It is the seemingly impossible dream of market technicians to discover an indicator or pattern that would consistently point to major turning points in the stock market, and although it is doubtful such an indicator exists, we have discovered a pattern that has been remarkable in its ability to discern approaching market tops. We stumbled upon the pattern in November 1992 because we were struck by the apparent lack of volatility in the daily number of advancing and declining issues on the NY Exchange. Over a period of 21 trading days (the number of trading days in the average month), the highest single day advance/decline ratio (simply divide up stocks by down stocks on the NY Exchange after the close) was 1.84 and the lowest was .71. Rather than use those exact limits as a precedent for further research, we arbitrarily widened the limits somewhat to .65 and 1.95. We first searched our computer database for other time periods of 21 trading days when similar "churning" occurred, periods that were noteworthy for their lack of volatility. Initially we went back to 1966 when the Dow made its first move to the 1,000 level. We were stunned by the results.

    From January 1966 to November 1992, a period of almost 27 years, there were only three other periods when the above conditions were satisfied, namely, over a 21 day period there was no daily ratio higher than 1.95 and no daily ratio lower than .65. Here are the only dates when those conditions were satisfied:

    January 25, 26, 27, 28 1966

    October 17, 18, 21, 22, 24, 25 1968

    December 6, 7, 8, 11 1972

    If you are acquainted with market history, you will recognize those immediately as time period just weeks before three of the most important market tops of the past 30-40 years. Just how important were they?

    The final 1966 top occurred on February 9, eleven trading days after January 25,the 21st day of the churning pattern. On an inflation-weighted Dow chart, the 1966 top stood until 1995 as an all time Dow high.

    In 1968, the pattern lasted 26 days. The final Dow high came on December 3, 27 market days after the churning pattern became official on October 17, its 21st day. From that 1968 high, the average share of stock and equity mutual fund lost 70-80% of its value over the next six years.

    The next time period to see 21 consecutive churning days was December 6, 1972. The final high in that time period occurred on January 11, 1973, 23 trading days after December 6. That top led to one of the sharpest two year Dow declines in history, almost 50% in less than 24 months.

    After reviewing those results, we felt we had discovered something special. During a period of almost 27 years, there were only three occurrences of the pattern and each occurrence led to a major market top within, at most, 27 trading days. We ultimately dubbed the pattern "The Sign of the Bear."

    We have learned in almost three decades of market research that any pattern that appears to have predictive potential should be researched as far back as is practicable. Without going into the detail of the sequence of our research from that point, we found that the period from 1940 to 1966 contained nine churning patterns. Most of them led to bearish resolutions, but none of those predicted tops ranked with the importance of the three tops detailed above, and some of the patterns in that time period did not lead to adverse market resolutions. When we worked backwards from 1940 to the beginning of our daily advance/decline data in 1926, however, we were once again stunned by the results. The first 21 day churning pattern prior to 1940 occurred on July 19, 1929. That’s right! Just over six weeks prior to the most famous top of this century, the "Sign of the bear" appeared.

    Our final research brought the data up to date through the current time period. In all, from 1926 to early April 1998, a period of over 72 years, there were only 19 churning patters of 21 days or longer. There were two long stretches of time, from mid 1929 to late 1952, and again from early 1966 to late 1992 when there was no one churning pattern. We bring this up to show the relative rarity of the pattern. Our problem in analyzing the nineteen prior churning patterns was to find potentially distinguishing characteristics between those churning patterns which led to important tops and major declines and the patterns which led to only short term declines, or worse yet, no decline at all. We have indeed discovered two such characteristics that have accompanied all the churning patterns that led to major market tops. The first characteristic is that the pattern must continue for no longer than 27 trading days. At first, it seemed to us intuitively that the longer the pattern ran, the more negative the ultimate repercussions should be. It just wasn't true.

    Five of the 19 patterns were longer than 27 trading days and none of them led to important market tops. Three of those five have occurred in the last six years. The second characteristic was the history of the pattern just after the consecutive days of churning ended. The following three days determine the predictive importance of the pattern. If the pattern is to lead to a major top, the two or three days after the churning pattern ends should be quite negative and we can quantify how negative they must be. Calculate the daily A/D ratio (advances divided by declines for the three days following the end of the pattern. Use both an average of the first two days and an average of the first three days after the pattern ends. If either of those averages is less than .75, the pattern becomes a "Sign of the Bear." Those two requirements eliminate 14 of the 19 prior churning patterns. Here is what is left:

    Date Days of churning Lowest Ratio (2 or 3 Day) Subsequent Decline

    July 19, 1929 22 .733 89.5%

    December 8, 1961 24 .647 29.1

    January 25, 1966 24 .396 26.5

    October 17, 1968 26 .582 36.9

    December 6, 1972 24 .585 46.5

    April 6, 1998 21 .592 46.5

    As you can see from the above table, a 21 day churning pattern ended on April 6, 1998. It fit both additional qualifications given above, making it only the sixth "Sign of the Bear" in the past 72 years. Be aware that the "Sign of the Bear" usually precedes the final market high; it does not coincide with or follow the market top. When we presented these data to subscribers the week of April 6-10, we noted that if this pattern resolved in a similar fashion to the last three resolutions the Dow would see a final high close of 9182.90 +_ 60 points. As technicians, all we deal with is probabilities. Be aware that although the "Sign of the Bear" has been rare in the past and effective in predicting market tops, it has been discovered after the fact, and we have never used it to predict a top in real time. It should not necessarily prompt you to sell all your stocks tomorrow morning. It should, however, caution you against the "new paradigm" fundamentalist outlook that nothing can go wrong with the market for at least several years. We can assure you that there were no fundamental indications of a market top at any of the above prior signals. Here is a quote from one of the prior time periods"

    "This prosperity might be disquieting if it were accompanied by any of the symptoms of inflation such as swelling inventories or a growing urge to buy for more than immediate requirements. It is also encouraging to see that despite the continuance of prosperity, commodity prices remain stable." –Outlook and Independent 8-7-29

    Because our cycles allow for a final top as late as August 1998, we have to allow for that possibility. If the market is making new highs beyond the end of May, then the power of the April signal will have dissipated. In that case we would look for the possibility of another "Sign of the Bear" prior to a July or early August top. But be on guard. The "Sign of the Bear" has been seen in this time period. It has not been wise to ignore it in the past.


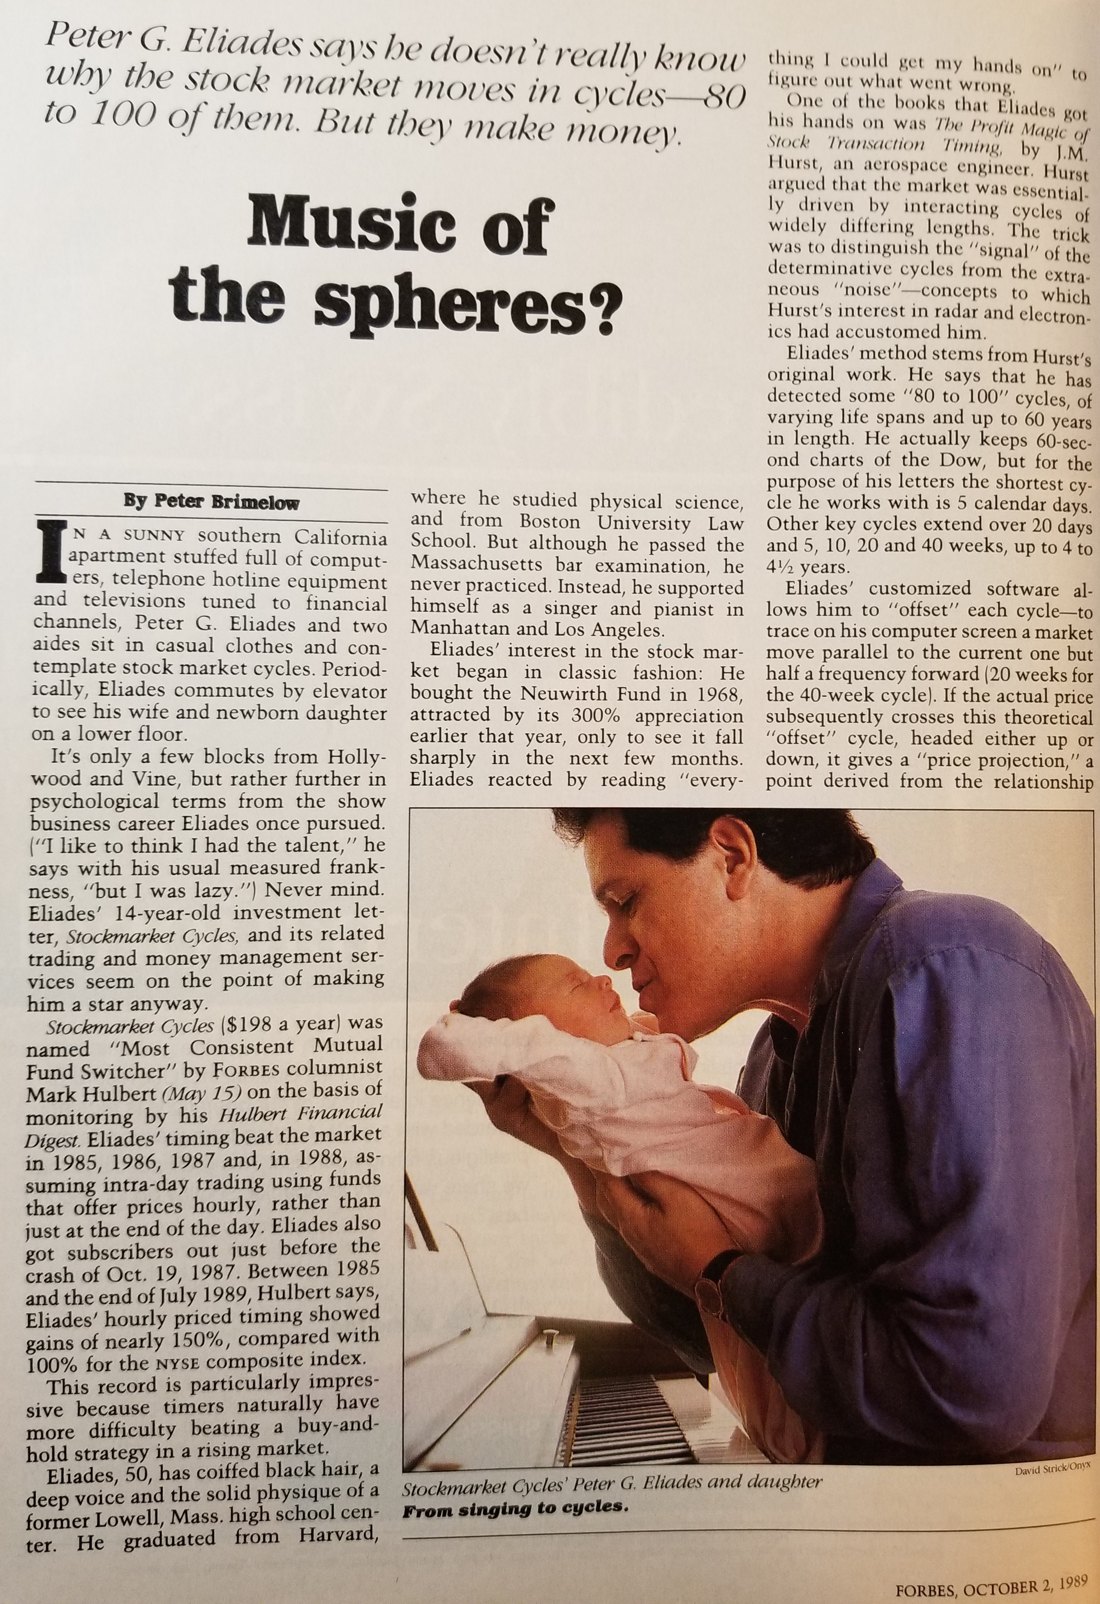
  • Forbes
    "Music of the spheres?"
  • Forbes
    Most Consistent Mutual Fund Switcher
  • Timer Digest
    Peter Eliades article
  • Stockmarket Cycles
    Calling the 1982 low
What happens next

Peter's work carries on.

The Eliades Cycle Price Projections app Peter built with Steffen remains in active development, with exciting new enhancements alongside ongoing Market Commentary.

Steffen Scheuermann

Steffen Scheuermann

Chief Analyst & Lead Developer

Steffen was introduced to Peter in 2018 by Peter's longtime friend and collaborator Larry Williams. For years Steffen and Peter worked together almost daily, turning Peter's cycle projection method into software and talking markets along the way. A longtime software developer and futures trader, Steffen now leads development of the app and provides the Market Commentary.

Marie Eliades

Marie Eliades

Owner

Peter's wife of 38 years and publisher at Zoë Press. Marie oversees the business and member accounts.