We welcome all comments related to market timing. We do not welcome political and insulting comments, however, and comments of a political nature belong elsewhere and could lead to removal and blocking the originator of such political comments.
You cannot post comments. Sign up for the Video or Bundle membership now and get access to exclusive content! Login for Members
MJMassens2570
What's interesting about BTC is that the continuum on the long term projection lines up with the halving due to take place in the Feb/March time frame. Meaning, it can have a rally during the halving in Feb/March, break above that ~45,000 resistance, and invalidate the downside projection to 10,000. The RSI Weekly does not yet have a negative divergence built up, meaning there is room for a drop and another rally. The Daily RSI does have significant divergence built up, and the closing price of the year 2021 is here right now at 46k. The local cycle top is here and now. But my suspicion is that this will rally again in the spring above 46k and invalidate the downside.
XXSPOWER127
MJMassens2570 said:
What's interesting about BTC is that the continuum on the long term projection lines up with the halving due to take place in the Feb/March time frame. Meaning, it can have a rally during the halving in Feb/March, break above that ~45,000 resistance, and invalidate the downside projection to 10,000. The RSI Weekly does not yet have a negative divergence built up, meaning there is room for a drop and another rally. The Daily RSI does have significant divergence built up, and the closing price of the year 2021 is here right now at 46k. The local cycle top is here and now. But my suspicion is that this will rally again in the spring above 46k and invalidate the downside.
^^^^^^ Now that is great info right there. I 100% agree. Also /ETH is a great short today tomorrow as well. But don't stay too long at the feast.
CS37
MJMassens2570 said:
What's interesting about BTC is that the continuum on the long term projection lines up with the halving due to take place in the Feb/March time frame. Meaning, it can have a rally during the halving in Feb/March, break above that ~45,000 resistance, and invalidate the downside projection to 10,000. The RSI Weekly does not yet have a negative divergence built up, meaning there is room for a drop and another rally. The Daily RSI does have significant divergence built up, and the closing price of the year 2021 is here right now at 46k. The local cycle top is here and now. But my suspicion is that this will rally again in the spring above 46k and invalidate the downside.
MJM: If I'm not mistaken, the BTC halving is expected in April 2024. And, if historical BTC halvings suggest anything about the future, they have shown that the upward rate of BTC price change increases AFTER the halving, relative to that observed before the halving.
XXSPOWER127
CS37 said:
MJMassens2570 said:
What's interesting about BTC is that the continuum on the long term projection lines up with the halving due to take place in the Feb/March time frame. Meaning, it can have a rally during the halving in Feb/March, break above that ~45,000 resistance, and invalidate the downside projection to 10,000. The RSI Weekly does not yet have a negative divergence built up, meaning there is room for a drop and another rally. The Daily RSI does have significant divergence built up, and the closing price of the year 2021 is here right now at 46k. The local cycle top is here and now. But my suspicion is that this will rally again in the spring above 46k and invalidate the downside.
MJM: If I'm not mistaken, the BTC halving is expected in April 2024. And, if historical BTC halvings suggest anything about the future, they have shown that the upward rate of BTC price change increases AFTER the halving, relative to that observed before the halving.
CS37
That is what MJM is saying
() But my suspicion is that this will rally again in the spring above 46k and invalidate the downside. ()
but right now - he is said this
so did MR. E
(*) The Daily RSI does have significant divergence built up, and the closing price of the year 2021 is here right now at 46k. The local cycle top is here and now
So, that means that the divergences need to be burnt off and re-set.
Maybe MJM can see targets I dont follow /BTC /ETH that much but I sure think it is time for a
retrace on /BTC /ETH /NQ then follows shortly thereafter as it has been following it
not sure why or what the correlation is but it has and I suspect /NQ will.
THEN after that YUGE BIGGLY
alengray99514666
Search the web about 1835. Can't find anything. looks like made up chart with 1935 and crash till 1842.
Link would help. event and dates
the event may happen in 2024. could be 1 year away. Not helpful at all. unless one is in Cash. If short, dead broke with no assets.
No money for Sub
XXSPOWER127
alengray99514666 said:
Search the web about 1835. Can't find anything. looks like made up chart with 1935 and crash till 1842.
Link would help. event and dates
the event may happen in 2024. could be 1 year away. Not helpful at all. unless one is in Cash. If short, dead broke with no assets.
No money for Sub
LMAO
BEEN SAYING just stay LONG
PETER WONT LOOK AT WEEKLY OR MONTHLY - BIG UPSIDES
4900 / ES
19000 / NQ
37500 / YM
2000 / RTY
BUT HE keeps yappin saying all upper PROJECTIONS MET
THEY ARE NOT
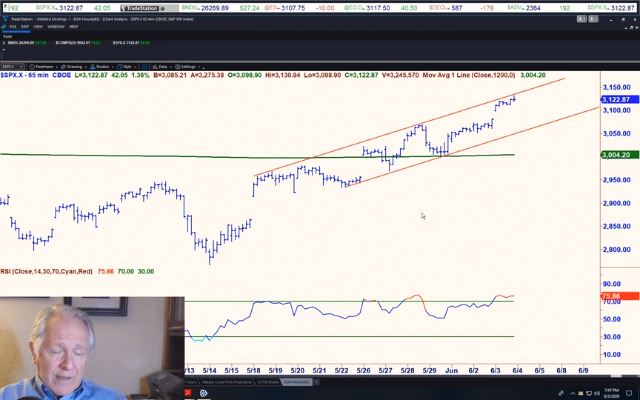
The S&P hit a new 2023 high on Friday, completing a breakout of the 20-month long ascending triangle.
GO TO
ANY DAILY projection - 7/8 10 /12 then click Monthly look at huge upside
NOTICE HE DOES NOT TALK ABOUT VIX
WHY? ITS NOT A BEAR
XXSPOWER127
THE DOW IS AT 37000 !!!
WHAT HAVE I BEEN TELLIN YA
/NQ 16500 SOON 17000
THEN 20000
/ES 5000 SOON
DONT BE A " TOP " PICKIN FOol study market history and breath thrusts
XXSPOWER127
WEEKLY ( THIS WEEK )
NASDAQ /NQ
12.1
16586 TO 17208
WHY DOES PETER NOT SHOW IT ?
I SEE IT
DOES ANYONE ELSE? OR ALL JUST BLIND ?
XXSPOWER127
/NQ WEEKLY 10.10 17160 TO 17250
AM I THE ONLY ONE WHO SEES IT?
ALL PROJECTIONS TO UPSIDE NOT MET
I KEEP TELLING YOU BUT NO ONE LISTENS
XXSPOWER127
@@@@ hey ALL YOU SUBS out there
IF YOU use tradestation and the projections
go to 48.4
SEE THE /ES
4900 ?
can you see what the " PERCENT " OF HIT IS FOR 10 YR AND 20 YR ?
 play_arrow
Comments (10)
You cannot post comments.
Sign up for the Video or Bundle membership now and get access to exclusive content!
Login for Members
What's interesting about BTC is that the continuum on the long term projection lines up with the halving due to take place in the Feb/March time frame. Meaning, it can have a rally during the halving in Feb/March, break above that ~45,000 resistance, and invalidate the downside projection to 10,000. The RSI Weekly does not yet have a negative divergence built up, meaning there is room for a drop and another rally. The Daily RSI does have significant divergence built up, and the closing price of the year 2021 is here right now at 46k. The local cycle top is here and now. But my suspicion is that this will rally again in the spring above 46k and invalidate the downside.
^^^^^^ Now that is great info right there. I 100% agree. Also /ETH is a great short today tomorrow as well. But don't stay too long at the feast.
MJM: If I'm not mistaken, the BTC halving is expected in April 2024. And, if historical BTC halvings suggest anything about the future, they have shown that the upward rate of BTC price change increases AFTER the halving, relative to that observed before the halving.
CS37
That is what MJM is saying
() But my suspicion is that this will rally again in the spring above 46k and invalidate the downside. () but right now - he is said this so did MR. E
(*) The Daily RSI does have significant divergence built up, and the closing price of the year 2021 is here right now at 46k. The local cycle top is here and now
So, that means that the divergences need to be burnt off and re-set.
Maybe MJM can see targets I dont follow /BTC /ETH that much but I sure think it is time for a retrace on /BTC /ETH /NQ then follows shortly thereafter as it has been following it not sure why or what the correlation is but it has and I suspect /NQ will.
THEN after that YUGE BIGGLY
Search the web about 1835. Can't find anything. looks like made up chart with 1935 and crash till 1842.
Link would help. event and dates the event may happen in 2024. could be 1 year away. Not helpful at all. unless one is in Cash. If short, dead broke with no assets. No money for Sub
LMAO BEEN SAYING just stay LONG
PETER WONT LOOK AT WEEKLY OR MONTHLY - BIG UPSIDES
4900 / ES 19000 / NQ 37500 / YM 2000 / RTY
BUT HE keeps yappin saying all upper PROJECTIONS MET THEY ARE NOT
The S&P hit a new 2023 high on Friday, completing a breakout of the 20-month long ascending triangle.
GO TO ANY DAILY projection - 7/8 10 /12 then click Monthly look at huge upside
NOTICE HE DOES NOT TALK ABOUT VIX WHY? ITS NOT A BEAR
THE DOW IS AT 37000 !!!
WHAT HAVE I BEEN TELLIN YA
/NQ 16500 SOON 17000
THEN 20000
/ES 5000 SOON
DONT BE A " TOP " PICKIN FOol study market history and breath thrusts
WEEKLY ( THIS WEEK )
NASDAQ /NQ
12.1
16586 TO 17208
WHY DOES PETER NOT SHOW IT ?
I SEE IT
DOES ANYONE ELSE? OR ALL JUST BLIND ?
/NQ WEEKLY 10.10 17160 TO 17250
AM I THE ONLY ONE WHO SEES IT?
ALL PROJECTIONS TO UPSIDE NOT MET
I KEEP TELLING YOU BUT NO ONE LISTENS
@@@@ hey ALL YOU SUBS out there
IF YOU use tradestation and the projections
go to 48.4
SEE THE /ES
4900 ?
can you see what the " PERCENT " OF HIT IS FOR 10 YR AND 20 YR ?
My tradestation does not show % of probability ..
But - this should be brought up
DONT YA THINK ?
1-10 of 10