We welcome all comments related to market timing. We do not welcome political and insulting comments, however, and comments of a political nature belong elsewhere and could lead to removal and blocking the originator of such political comments.
You cannot post comments. Sign up for the Video or Bundle membership now and get
access to exclusive content! Login for Members
andrewturchindmd379
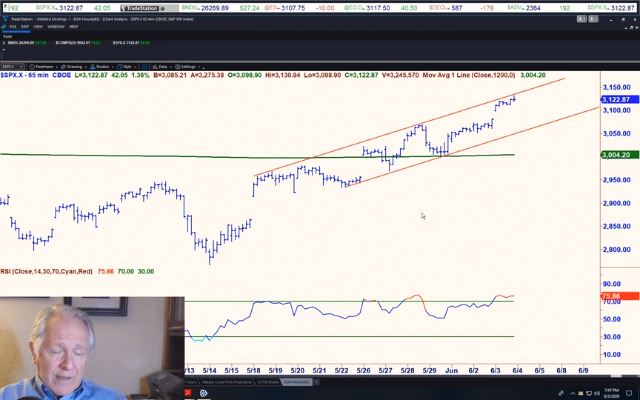
Peter, I concur that this looks like A top, but my elliot work was another high coming after a move back down to the recent 5/19 low. So I can't help wonder if your work/software would allow for it. When I look at your video of the 45/52 offset zoomed out, it sure looks like 1. breaking the offset channel would give a projection to around the 5/19 low. And if the market rallied off there like I suspect to a new high near the end of june. Wouldn't that be another loop projection. And looking at the upward slope of the signal lines, it sure looks like that it would give a projection near my work's target, which is a 15% rally from the 5/19 price area. I'm curious if anything in your work precludes this larger loop projection that I can see happening to match my elliot wave count? Thank, Andrew
daniel039209
Can you show us all ONE of the cycles that you have been broadcasting for years, that allegedly have turned down? Show us one. And so you think if anyone took your theoretical trade did it by shorting a lot of futures at, 29,240? No. One would buy puts. And watch their $$$$ disappear. Has to be 75+ loss if anyone bought into your theoretical negative position. Oh dear, I think all the futures are up again tonight. This is only service that thinks new all time highs is the most negative setup of all!! Amazing
daniel039209
andrewturchindmd379 said:
Peter, I concur that this looks like A top, Thank, Andrew
Andrew, what technical weakness or breakdown of trend indicated to you that “ this looks like a top”? Curious.
rickjendz64
Enjoy your time off Peter!
XXSPOWER127
daniel039209 said:
Can you show us all ONE of the cycles that you have been broadcasting for years, that allegedly have turned down? Show us one. And so you think if anyone took your theoretical trade did it by shorting a lot of futures at, 29,240? No. One would buy puts. And watch their $$$$ disappear. Has to be 75+ loss if anyone bought into your theoretical negative position. Oh dear, I think all the futures are up again tonight. This is only service that thinks new all time highs is the most negative setup of all!! Amazing
HE DOES NOT LOOK AT THE PIE CHART OF THE PROJECTIONS EITHER
KEEPS SAYING " WE REACHED ALL PROJECTIONS " WELL IF YOU LOOK AT /ES WEEKLY AND /ES DAILY WE HAVE NOT
SO.... HE DOES NOT EVEN LOOK AT HIS OWN SOFTWARE PROJECTIONS
UNREAL
DAY AFTER DAY SAME THING
daniel039209
XXSPOWER127 said:
daniel039209 said:
Can you show us all ONE of the cycles that you have been broadcasting for years, that allegedly have turned down? Show us one. And so you think if anyone took your theoretical trade did it by shorting a lot of futures at, 29,240? No. One would buy puts. And watch their $$$$ disappear. Has to be 75+ loss if anyone bought into your theoretical negative position. Oh dear, I think all the futures are up again tonight. This is only service that thinks new all time highs is the most negative setup of all!! Amazing
HE DOES NOT LOOK AT THE PIE CHART OF THE PROJECTIONS EITHER
KEEPS SAYING " WE REACHED ALL PROJECTIONS " WELL IF YOU LOOK AT /ES WEEKLY AND /ES DAILY WE HAVE NOT
SO.... HE DOES NOT EVEN LOOK AT HIS OWN SOFTWARE PROJECTIONS
UNREAL
DAY AFTER DAY SAME THING
exactly. he must really hate them after yesterdays new all time highs. And first week of June , historically positve, then get a little slip june15- 26 then back up buy that dip end of week june 26
Last updated
andrewturchindmd379
daniel039209 said:
andrewturchindmd379 said:
Peter, I concur that this looks like A top, Thank, Andrew
Andrew, what technical weakness or breakdown of trend indicated to you that “ this looks like a top”? Curious
Daniel, just saw this. I was seeing negative divergences in rsi on tthe 10 and 15 minute time frames. It seems those divergences kept building as they often do. So I was a week and 1% early but the breakdown happened and now we are getting close to my target for a B wave. I still expect a C wave up until July 20thish with a loop projection. I could see us going back up to the high and then back down to this coming low for a flat beforewave C really takes hold. Careful with using seasonailty as the market caneasily can go against that. Like it did this week or I'll never forget christmas of 2018 the markets were tanking. We might have similar this July 4th week. Trade Safe
 play_arrow
Comments (7)
You cannot post comments.
Sign up for the Video or Bundle membership now and get access to exclusive content!
Login for Members
Peter, I concur that this looks like A top, but my elliot work was another high coming after a move back down to the recent 5/19 low. So I can't help wonder if your work/software would allow for it. When I look at your video of the 45/52 offset zoomed out, it sure looks like 1. breaking the offset channel would give a projection to around the 5/19 low. And if the market rallied off there like I suspect to a new high near the end of june. Wouldn't that be another loop projection. And looking at the upward slope of the signal lines, it sure looks like that it would give a projection near my work's target, which is a 15% rally from the 5/19 price area. I'm curious if anything in your work precludes this larger loop projection that I can see happening to match my elliot wave count? Thank, Andrew
Can you show us all ONE of the cycles that you have been broadcasting for years, that allegedly have turned down? Show us one. And so you think if anyone took your theoretical trade did it by shorting a lot of futures at, 29,240? No. One would buy puts. And watch their $$$$ disappear. Has to be 75+ loss if anyone bought into your theoretical negative position. Oh dear, I think all the futures are up again tonight. This is only service that thinks new all time highs is the most negative setup of all!! Amazing
Andrew, what technical weakness or breakdown of trend indicated to you that “ this looks like a top”? Curious.
Enjoy your time off Peter!
HE DOES NOT LOOK AT THE PIE CHART OF THE PROJECTIONS EITHER KEEPS SAYING " WE REACHED ALL PROJECTIONS " WELL IF YOU LOOK AT /ES WEEKLY AND /ES DAILY WE HAVE NOT SO.... HE DOES NOT EVEN LOOK AT HIS OWN SOFTWARE PROJECTIONS
UNREAL
DAY AFTER DAY SAME THING
exactly. he must really hate them after yesterdays new all time highs. And first week of June , historically positve, then get a little slip june15- 26 then back up buy that dip end of week june 26
Last updated
Daniel, just saw this. I was seeing negative divergences in rsi on tthe 10 and 15 minute time frames. It seems those divergences kept building as they often do. So I was a week and 1% early but the breakdown happened and now we are getting close to my target for a B wave. I still expect a C wave up until July 20thish with a loop projection. I could see us going back up to the high and then back down to this coming low for a flat beforewave C really takes hold. Careful with using seasonailty as the market caneasily can go against that. Like it did this week or I'll never forget christmas of 2018 the markets were tanking. We might have similar this July 4th week. Trade Safe
1-7 of 7