We welcome all comments related to market timing. We do not welcome political and insulting comments, however, and comments of a political nature belong elsewhere and could lead to removal and blocking the originator of such political comments.
You cannot post comments. Sign up for the Video or Bundle membership now and get access to exclusive content! Login for Members
dr191103
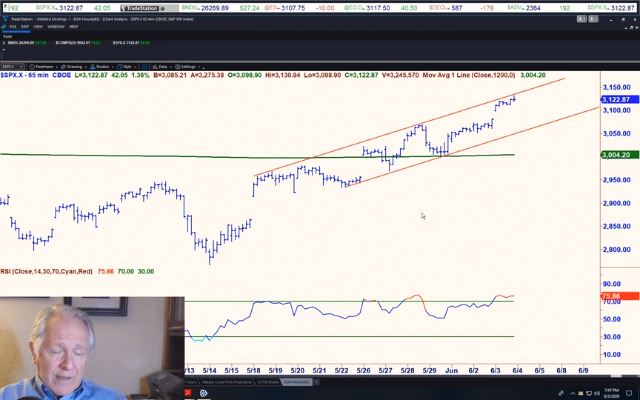
Hello Peter. Are those red vertical lines the 54 day cycle you have talked about in the past? If so how can I get that on my charts? Maybe share a template? Still loving the software after 1+ years
Peter Eliades
Moderator
dr191103 said:
Hello Peter. Are those red vertical lines the 54 day cycle you have talked about in the past? If so how can I get that on my charts? Maybe share a template? Still loving the software after 1+ years
The red lines on this chart were actually a 38 trading day turning point pattern. Just right click on a blank part of the chart and go to: Drawing--Time Cycle. Usually the default is 10 periods but you can grab a line from the bottom and put in any number of days you want... So happy you are loving the software. Once you use it, it's hard to live without!
daniel039209
If your projections showed similar, not exactly the same, MAJOR downside targets year ago- and we had almost a historic rally ?20-36% depending on index- how could you have possibly survived to be in the game to short yet again? Yes, markets typically “break lower” not from highs but from a “shelf” down from highs. We could trade to 3900 maybe lower SPX. But it is almost inconceivable that NDX would be 4000. Not sure how to manage positions if 85% of projections are down. I guess cash
jackwaterman224588
daniel039209 said:
If your projections showed similar, not exactly the same, MAJOR downside targets year ago- and we had almost a historic rally ?20-36% depending on index- how could you have possibly survived to be in the game to short yet again? Yes, markets typically “break lower” not from highs but from a “shelf” down from highs. We could trade to 3900 maybe lower SPX. But it is almost inconceivable that NDX would be 4000. Not sure how to manage positions if 85% of projections are down. I guess cash
Just look at BTC. Long term Projection, 4000 On NDX could be Many moons away. October lows is still standing and we are looking for 4K, NDX/Dow ratio chart is still alive and well. NDX is still above 200DMA
daniel039209
jackwaterman224588 said:
daniel039209 said:
If your projections showed similar, not exactly the same, MAJOR downside targets year ago- and we had almost a historic rally ?20-36% depending on index- how could you have possibly survived to be in the game to short yet again? Yes, markets typically “break lower” not from highs but from a “shelf” down from highs. We could trade to 3900 maybe lower SPX. But it is almost inconceivable that NDX would be 4000. Not sure how to manage positions if 85% of projections are down. I guess cash
Just look at BTC. Long term Projection, 4000 On NDX could be Many moons away. October lows is still standing and we are looking for 4K, NDX/Dow ratio chart is still alive and well. NDX is still above 200DMA
I wont short a share until Nov 2 we are 2.2% off lows from friday SPX. NDX def lagging now that street realizes tech earns way too high
daniel039209
NVDA looks like it trapped sellers/shorties UNDER 400. Back to 435 looks like
dcarter8883312
daniel039209 said:
NVDA looks like it trapped sellers/shorties UNDER 400. Back to 435 looks like
I covered NVDA it almost did .382 retracement. I will buy November 30 Puts Tomorrow If it sells off below 402.
~Dorothy
dcarter8883312
Peter:
Did NVDA give you lower projections today? Please cover in update.
Thanks ~ Dorothy
 play_arrow
Comments (8)
You cannot post comments.
Sign up for the Video or Bundle membership now and get access to exclusive content!
Login for Members
Hello Peter. Are those red vertical lines the 54 day cycle you have talked about in the past? If so how can I get that on my charts? Maybe share a template? Still loving the software after 1+ years
The red lines on this chart were actually a 38 trading day turning point pattern. Just right click on a blank part of the chart and go to: Drawing--Time Cycle. Usually the default is 10 periods but you can grab a line from the bottom and put in any number of days you want... So happy you are loving the software. Once you use it, it's hard to live without!
If your projections showed similar, not exactly the same, MAJOR downside targets year ago- and we had almost a historic rally ?20-36% depending on index- how could you have possibly survived to be in the game to short yet again? Yes, markets typically “break lower” not from highs but from a “shelf” down from highs. We could trade to 3900 maybe lower SPX. But it is almost inconceivable that NDX would be 4000. Not sure how to manage positions if 85% of projections are down. I guess cash
Just look at BTC. Long term Projection, 4000 On NDX could be Many moons away. October lows is still standing and we are looking for 4K, NDX/Dow ratio chart is still alive and well. NDX is still above 200DMA
I wont short a share until Nov 2 we are 2.2% off lows from friday SPX. NDX def lagging now that street realizes tech earns way too high
NVDA looks like it trapped sellers/shorties UNDER 400. Back to 435 looks like
I covered NVDA it almost did .382 retracement. I will buy November 30 Puts Tomorrow If it sells off below 402. ~Dorothy
Peter: Did NVDA give you lower projections today? Please cover in update. Thanks ~ Dorothy
1-8 of 8